Benchmarking Small Area Estimates in Python with svy-sae
Ratio and raking benchmarks to known or estimated targets
Tutorials
Area-level
Benchmarking
Python
Benchmark Fay-Herriot small area estimates in Python with svy-sae so they agree with regional or national figures: ratio and raking adjustments, targets estimated from the same survey, and bootstrap MSE of the benchmarked estimates.
Author
Mamadou S. Diallo, Ph.D.
Modified
November 5, 2026
Keywords
benchmarking small area estimates, Fay-Herriot benchmarking Python, ratio benchmarking raking, consistent small area estimates, bootstrap MSE benchmarked estimates
WarningAbout these examples
This tutorial illustrates the svy-sae API; it is not a rigorous small area analysis. The models are kept simple so each step stays readable, and in many places, from the choice of covariates to the variance model, better choices could be made to improve them.
District estimates are rarely published alone. The survey that produced them also publishes regional and national figures, and readers expect the districts of a region to add up to the region. Model-based estimates do not do so on their own: Checking the model found regions where the districts’ aggregate and the regional estimate are far apart.
Benchmarking adjusts the estimates so each group’s size-weighted mean equals a target. It buys consistency, and its cost depends on the targets: adjusting to an accurate figure can improve the estimates, while adjusting to a noisy one passes its error on to every district of the group.
This tutorial demonstrates how to benchmark the district poverty rates to regional and national targets with Benchmark, choose between ratio and raking adjustments, account for targets that are themselves estimates, and measure what benchmarking does to accuracy.
NoteNot a search for the best model
This tutorial does not try to find the best model for these data. It shows the options svy-sae offers to evaluate a model and the ways to improve it; the choices made below are examples, not recommendations.
Setting up the inputs
We continue with the inputs and the model of the previous tutorials:
A region’s rate is the mean of its districts’ rates weighted by their number of households. The sizes frame gives every district its region and its size, n_hh from the census. It also holds each district’s weight in the regional direct estimate, the sum of its survey weights, used below:
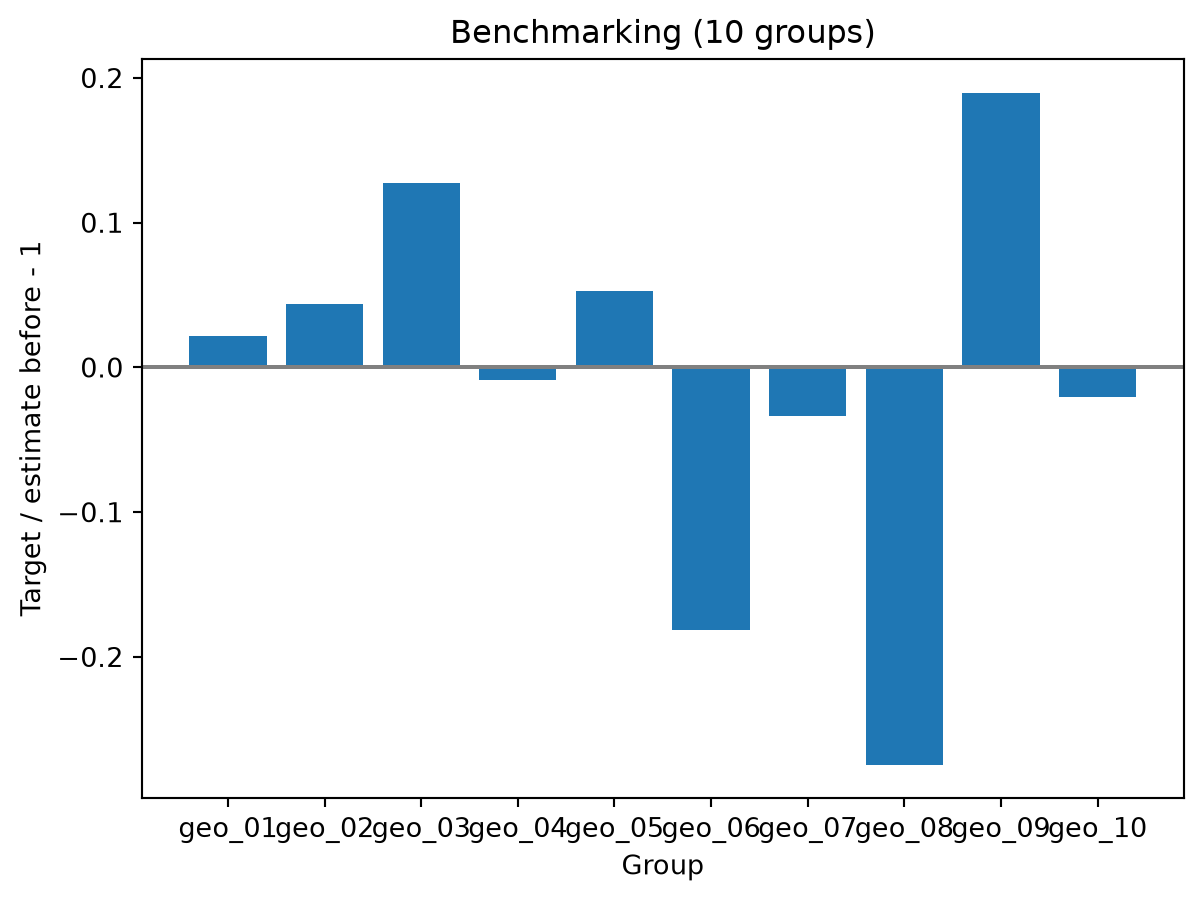
The predictions are the benchmarked estimates. The report shows each region’s target, the aggregate before benchmarking, and the relative change:
fit_bench.to_polars("benchmark")
shape: (10, 4)
group
target
before
change
str
f64
f64
f64
"geo_01"
0.085854
0.084013
0.021922
"geo_02"
0.341601
0.327366
0.043484
"geo_03"
0.218635
0.193967
0.127176
"geo_04"
0.171531
0.17307
-0.008893
"geo_05"
0.323229
0.307004
0.05285
"geo_06"
0.218746
0.26723
-0.181434
"geo_07"
0.227652
0.235576
-0.033638
"geo_08"
0.252795
0.348402
-0.274415
"geo_09"
0.320075
0.268993
0.189902
"geo_10"
0.227131
0.23195
-0.020776
fit_bench.plots.benchmark();
Change made to each region
Four regions move by more than 10%, which the fit flags as SAE_BENCHMARK_LARGE. The estimates before benchmarking stay in the diagnostics as pred_unbenchmarked, and the calibration check of Checking the model now reports no gap:
Multiply a group’s estimates by target / aggregate
"raking"
Add target − aggregate to a group’s estimates
targets
number
One target for all areas, with no group
frame
One row per group, with group and a target column
sizes, area, size, group
frame and columns
Each area’s key, size, and group; sizes are normalised within each group
direct_weight
column of sizes
Each area’s weight in its group’s direct estimate, when the targets are direct estimates from the same survey
Ratio benchmarking keeps rates positive and changes each district in proportion to its level; raking shifts every district of a region by the same amount, which can push a low rate below zero.
Targets that are estimates
The regional targets come from the same survey as the district direct estimates, so they have sampling error too, correlated with the districts’. direct_weight tells the bootstrap how each regional estimate is built from the district ones, so it re-estimates the targets in every replicate. Without it, the targets are treated as known exactly, and the MSE leaves out their error. Compare the two against the true rates:
The estimates are the same; only the MSE differs. Treated as known, the targets’ error is missing from the MSE, and the intervals miss the truth for a third of the districts. With direct_weight, the MSE covers it.
WarningEstimated targets
When the targets are direct estimates from the same survey, pass direct_weight. Leave it out only for targets known without sampling error, such as census counts or administrative totals.
What benchmarking does to accuracy
Benchmarking to the regional direct estimates moves the districts toward those estimates, errors included. In geo_08, the regional estimate is about one standard error below the true rate, and benchmarking pulls all its districts down with it.
The census gives the true regional and national rates. Here they stand in for figures known from another source, such as a census or an administrative register:
Benchmarking to the regional direct estimates makes the district estimates less accurate: it trades accuracy for consistency with the published regional figures. Benchmarking to accurate figures improves them, because it corrects the model’s own errors at the regional level.
TipWhether to benchmark
Benchmark when consistency with published figures is required, or when the targets are more accurate than the model’s aggregates. Check calibration first: a large gap may come from the targets rather than the model.
Summary
This tutorial benchmarked the district poverty rates:
Benchmark with regional targets, district sizes, and groups, passed to fh() with the bootstrap MSE
The report, to_polars("benchmark") and plots.benchmark(), and calibration with no gap afterwards
Ratio or raking: scale or shift each group’s estimates
direct_weight for targets estimated from the same survey, so the MSE includes their error
Accuracy: benchmarking passes the targets’ errors to the districts; accurate targets improve the estimates
Next steps
The area-level workflow is complete, from direct estimates to benchmarked district estimates. With unit records and a census, unit-level models use more of the data.