Checking a Fay–Herriot Model in Python with svy-sae
Findings, model tests, influence, plots, and calibration
Tutorials
Area-level
Diagnostics
Python
Check a Fay-Herriot small area model in Python with svy-sae: findings with codes, normality and goodness-of-fit tests, Cook’s distance, diagnostic plots, and calibration against higher-level estimates.
Author
Mamadou S. Diallo, Ph.D.
Modified
November 5, 2026
Keywords
Fay-Herriot diagnostics, small area model checking Python, Cook’s distance small areas, Brown goodness-of-fit test, SAE diagnostic plots, calibration small area estimates
WarningAbout these examples
This tutorial illustrates the svy-sae API; it is not a rigorous small area analysis. The models are kept simple so each step stays readable, and in many places, from the choice of covariates to the variance model, better choices could be made to improve them.
The Fay–Herriot model rests on assumptions: normal area effects and sampling errors, a linear relation with the covariates, and sampling variances that are right. Its estimates are only as good as those assumptions, so check them before publishing.
Every fh() fit computes its checks when it is fitted and stores them with the results, so they need no access to the data afterwards. Rules applied to those checks produce findings, each with a code, in the same form as svy’s warnings.
This tutorial demonstrates how to read the findings, the model-level tests, and the per-district diagnostics, find influential districts, draw the diagnostic plots, and compare the estimates with regional estimates.
NoteNot a search for the best model
This tutorial does not try to find the best model for these data. It shows the options svy-sae offers to evaluate a model and the ways to improve it; the choices made below are examples, not recommendations.
Setting up the inputs
We continue with the inputs from the previous tutorials, and fit the model chosen in Choosing covariates next to the baseline without covariates:
Each has a level (warning or info), a title, the detail behind it, and often a hint. The rules and their codes:
Table 1: Findings of a Fay–Herriot fit
Code
Raised when
SAE_SIGMA_U_BOUNDARY
\(\hat\sigma^2_u\) is below boundary_tol times the median sampling variance
SAE_NONNORMAL_RESIDUALS
Shapiro–Wilk rejects normality of the standardized residuals at alpha
SAE_NONNORMAL_AREA_EFFECTS
Shapiro–Wilk rejects normality of the standardized area effects at alpha
SAE_INFLUENTIAL_AREAS
An area’s Cook’s distance exceeds cooks_max (default \(4/m\) for \(m\) sampled areas)
SAE_BIAS_VS_DIRECT
The Brown test rejects agreement between model and direct estimates at alpha
SAE_RESIDUAL_PATTERN
Residuals correlate with the synthetic estimate or a covariate at alpha
SAE_COLLINEARITY
A covariate’s variance inflation factor exceeds vif_max
SAE_HIGH_CV
An estimate’s CV exceeds cv_max
SAE_NO_CV_GAIN
A sampled area’s model CV is not below its direct CV
SAE_BENCHMARK_LARGE
Benchmarking moved a group by more than shift_max
The model with piped water raises three. The boundary was explained in The Fay–Herriot model: the covariate leaves almost no variation between districts. The influential districts are examined below. The high CVs are an info: most districts are now well below 30%.
Without covariates, the residuals and area effects are not normal, and six districts gain no precision from the model.
Changing the thresholds
diagnostics.findings() applies the rules again with other thresholds:
[(f.code, f.title) for f in fit.diagnostics.findings(cv_max=0.2, boundary_tol=1e-6)]
[('SAE_INFLUENTIAL_AREAS', '2 influential areas'),
 ('SAE_HIGH_CV', '19 of 61 areas with CV above 0.2')]
Its arguments are alpha (0.05), cv_max (0.3), boundary_tol (0.001), cooks_max (\(4/m\)), shift_max (0.1), and vif_max (10). They change only the rules, never the stored statistics.
Model-level tests
The statistics behind the findings:
fit.to_polars("tests")
shape: (14, 5)
name
applies_to
statistic
df
p_value
str
str
f64
f64
f64
"shapiro_residuals"
"residuals"
0.981229
null
0.49425
"skewness_residuals"
"residuals"
0.117548
null
null
"kurtosis_residuals"
"residuals"
3.339098
null
null
"shapiro_area_effects"
"area_effects"
0.977658
null
0.348468
"skewness_area_effects"
"area_effects"
0.510638
null
null
…
…
…
…
…
"synthetic_direct_correlation"
"model"
0.512491
null
null
"sigma_u2_to_median_d"
"model"
0.000042
null
null
"resid_vs_synthetic"
"residuals"
-0.07876
null
0.55322
"resid_vs_piped_water"
"residuals"
0.07876
null
0.55322
"vif_piped_water"
"covariates"
1.0
null
null
Table 2: Model-level tests
Test
What it measures
shapiro_*, skewness_*, kurtosis_*
Normality of the standardized residuals and area effects
adj_r2, fh_r2
Share of the variation explained by the covariates; fh_r2 accounts for the sampling variances
brown
Goodness of fit of the model estimates to the direct ones, a chi-square on \(m\) degrees of freedom
synthetic_direct_correlation
Correlation of the synthetic and direct estimates
sigma_u2_to_median_d
\(\hat\sigma^2_u\) relative to the median sampling variance
resid_vs_*
Correlation of the residuals with the synthetic estimate and each covariate
Next to the estimate and its MSE and CV, the table has the direct estimate and its variance and CV, the synthetic estimate and the fitted value, the shrinkage factor gamma, the area effect u_hat and its standardized value u_std, the standardized residual resid_std, Cook’s distance cooks_d, and each covariate as x_<name>.
Influential districts
Cook’s distance measures how much the fitted coefficients move when a district is left out. Sort by it:
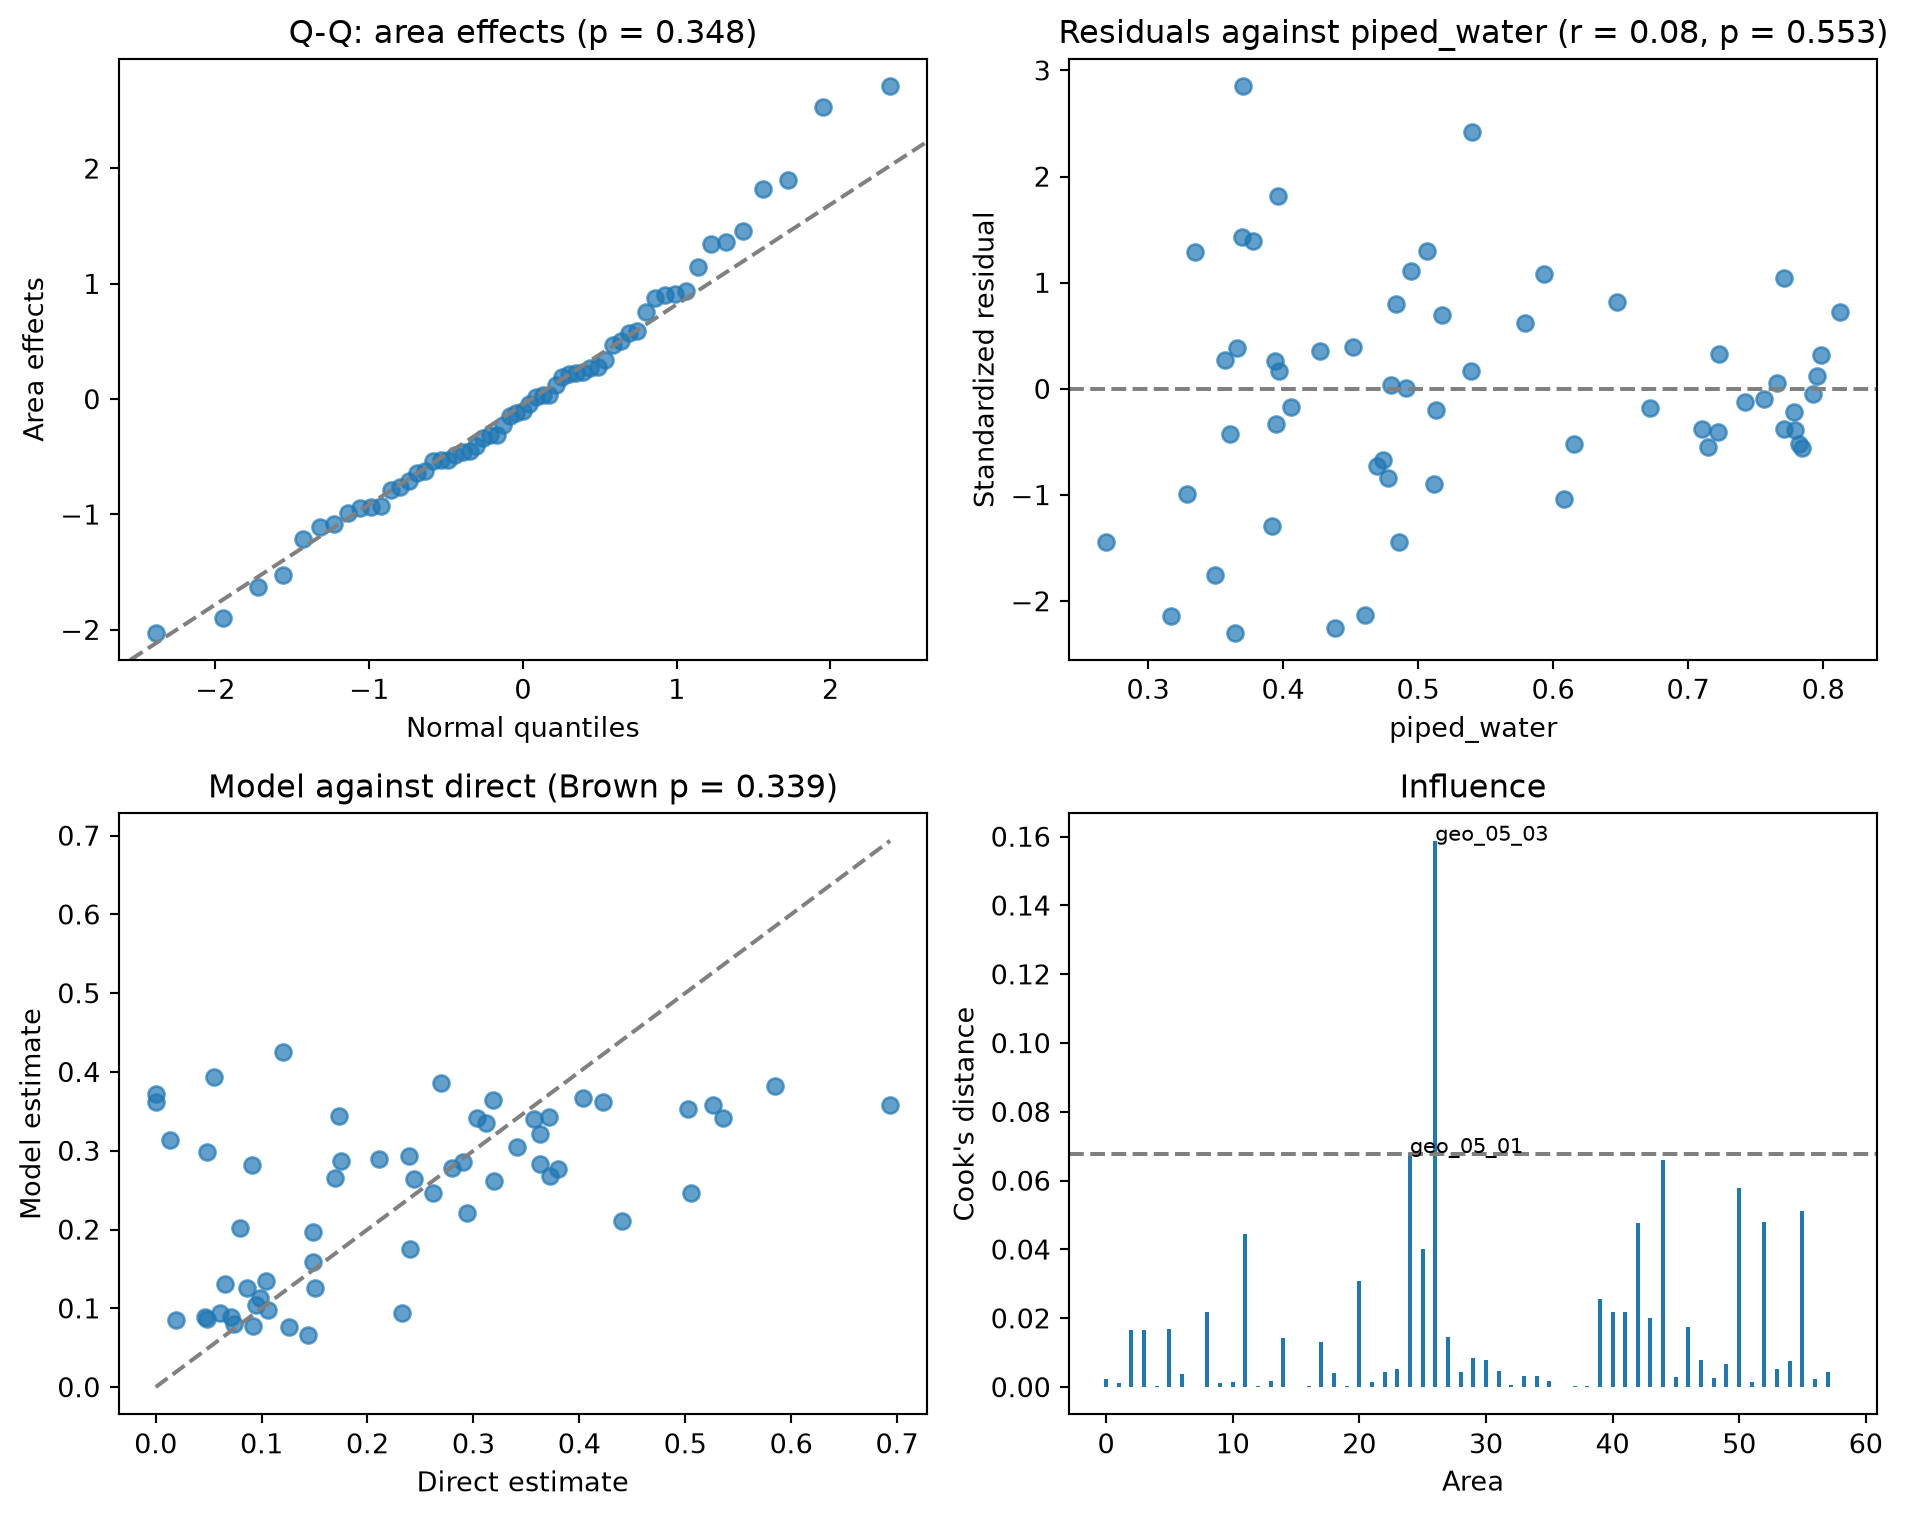
geo_05_03 has a direct poverty rate of 69%, against a synthetic 36%; geo_05_01 has 6% against 39%. Refit without them and see how far the estimates move:
The two districts still get estimates, from the census covariates, and no estimate moves by more than a percentage point. They are influential by Cook’s rule of thumb, but they do not drive the results.
Diagnostic plots
fit.plots draws from the stored diagnostics. Each plot takes ax= and returns the matplotlib axes, so plots combine into figures. The plots need matplotlib: pip install "svy-sae[plot]".
Normal Q-Q plot of the standardized area effects (level="residual" for the residuals)
residuals(against="fitted")
Standardized residuals against the fitted values or a covariate
shrinkage()
Weight on the direct estimate against the sampling variance
model_vs_direct()
Model estimates against direct estimates, with the 45-degree line
cv()
CVs of the direct and model estimates, districts ordered by direct CV
cooks(threshold=None)
Cook’s distance by district, with the threshold
benchmark()
Change made to each group by benchmarking
compare(*others, what="cv")
This fit against other fits, by CV or by estimate
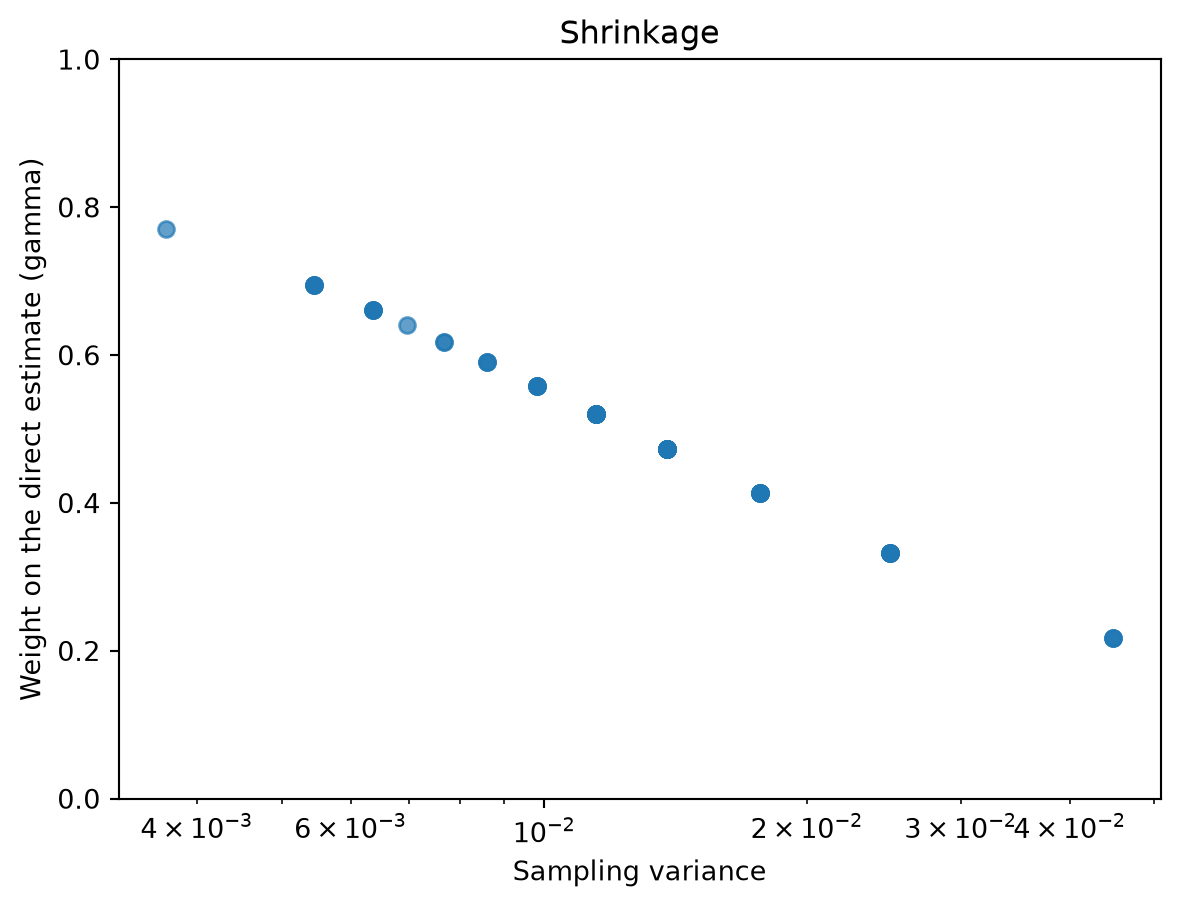
With the area variance at the boundary, every gamma is near zero and the shrinkage plot is flat. The baseline shows what it looks like when the model shrinks: the noisier a district’s direct estimate, the less weight it keeps:
fit_base.plots.shrinkage();
Shrinkage in the baseline model
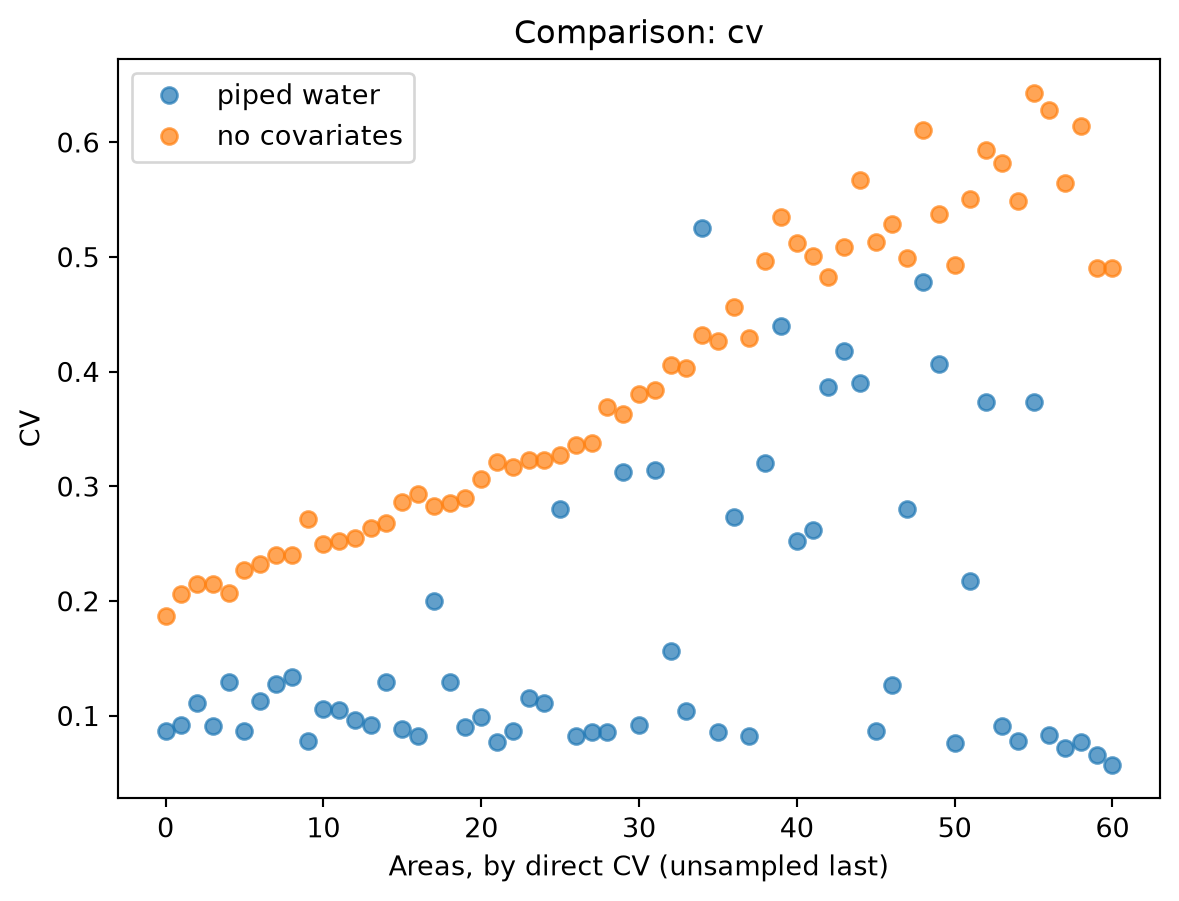
compare() puts fits side by side. Piped water lowers the CV of almost every district:
fit.plots.compare(fit_base, labels=["piped water", "no covariates"]);
CVs of the two models
Calibration against regional estimates
The survey supports reliable estimates for the ten regions. diagnostics.calibration() aggregates the district estimates to regions, weighting by the number of households, and compares them with targets, adjusting nothing:
difference is the aggregate over the target, minus one. Some regions are far apart. But a regional direct estimate is an estimate too, with its own error. Add the regional standard errors and the true regional rates:
In geo_08, the largest gap, the model’s aggregate matches the true rate. The regional direct estimate is the one that is off, by about one of its standard errors: ordinary sampling error. A gap between model and direct estimates is a question to look into, not proof that the model is wrong. Benchmarking forces the two to agree, so check calibration before deciding to benchmark.
Summary
This tutorial checked the Fay–Herriot model:
Findings with codes, from to_polars("findings"), re-applied with other thresholds by diagnostics.findings()
Model-level tests in to_polars("tests"): normality, R², the Brown test, residual correlations, and VIFs
Per-district diagnostics in to_polars("diagnostics"), and influential districts by Cook’s distance, checked by refitting without them
Plots from fit.plots, each on its own axes
Calibration of the aggregated estimates against regional estimates, which have errors of their own
Next steps
Poverty rates are proportions, bounded by 0 and 1. A transformation keeps the model on a scale where that bound holds.