Unit and district diagnostics, findings, and plots
Tutorials
Unit-level
Diagnostics
Python
Check unit-level small area models in Python with svy-sae: residuals and Cook’s distance for every sampled unit and area, normality, R² and ICC, findings, diagnostic plots, and what a transformation changes.
Author
Mamadou S. Diallo, Ph.D.
Modified
November 5, 2026
Keywords
unit-level model diagnostics, nested error regression diagnostics, Cook’s distance mixed model, ICC small area estimation, EBLUP EBP model checking Python
WarningAbout these examples
This tutorial illustrates the svy-sae API; it is not a rigorous small area analysis. The models are kept simple so each step stays readable, and in many places, from the choice of covariates to the variance model, better choices could be made to improve them.
The BHF model assumes that the area effects and the unit errors are normal, and that the outcome is linear in the covariates. The BHF model found its MSE well below the actual error of its estimates, a sign that these assumptions fail.
Every eblup() and ebp() fit computes its checks when it is fitted: one row per sampled unit, one row per area, and model-level tests, with findings from rules on them, as at the area level.
This tutorial demonstrates how to read the unit-level findings, tests, and tables, trace an influential household back to the data, draw the diagnostic plots, and see what a transformation changes.
NoteNot a search for the best model
This tutorial does not try to find the best model for these data. It shows the options svy-sae offers to evaluate a model and the ways to improve it; the choices made below are examples, not recommendations.
Setting up the inputs
We continue with the inputs and the model of The BHF model:
Rebuild the inputs from Preparing unit-level inputs
import polars as plimport svyimport svy_sae as saeyes_no = ["electricity", "car", "refrigerator", "tv", "cell", "bank"]covariates = ["urban", "piped_water", "flush_toilet", *yes_no, "hhsize", "rooms",]def household_covariates(frame):return frame.with_columns( (pl.col("tot_exp") / pl.col("hhsize")).alias("exp_pp"), (pl.col("urbrur") =="Urban").cast(pl.Float64).alias("urban"), (pl.col("piped_water") !="No piped water").cast(pl.Float64).alias("piped_water"), (pl.col("flush_toilet") =="Flush toilet").cast(pl.Float64).alias("flush_toilet"),*[(pl.col(c) =="Yes").cast(pl.Float64).alias(c) for c in yes_no], pl.col("hhsize").cast(pl.Float64), pl.col("rooms").cast(pl.Float64), )hld_data = household_covariates(svy.datasets.load("hld_sample_wb_2023").data)hld_census = household_covariates(svy.datasets.load("hld_pop_wb_2023").data)census_units = hld_census.select("geo1", "geo2", *covariates)census_means = hld_census.group_by("geo2").agg(*[pl.col(c).mean() for c in covariates], pl.len().alias("n_hh"))truth = hld_census.group_by("geo2").agg( pl.col("exp_pp").mean().alias("true_mean"), (pl.col("exp_pp") <1800).mean().alias("true_rate"),)
model = sae.UnitLevel(hld_data)fit = model.eblup( y="exp_pp", x=covariates, area="geo2", pop_data=census_means, pop_size="n_hh")
Unit-level fits apply a subset of the area-level rules, with the same codes:
Table 1: Findings of a unit-level fit
Code
Raised when
SAE_SIGMA_U_BOUNDARY
The intra-area correlation (ICC) is below boundary_tol
SAE_NONNORMAL_RESIDUALS
Shapiro–Wilk rejects normality of the unit residuals at alpha
SAE_NONNORMAL_AREA_EFFECTS
Shapiro–Wilk rejects normality of the predicted area effects at alpha
SAE_INFLUENTIAL_AREAS
An area’s Cook’s distance exceeds cooks_max (default \(4/m\) for \(m\) sampled areas)
SAE_COLLINEARITY
A covariate’s variance inflation factor exceeds vif_max
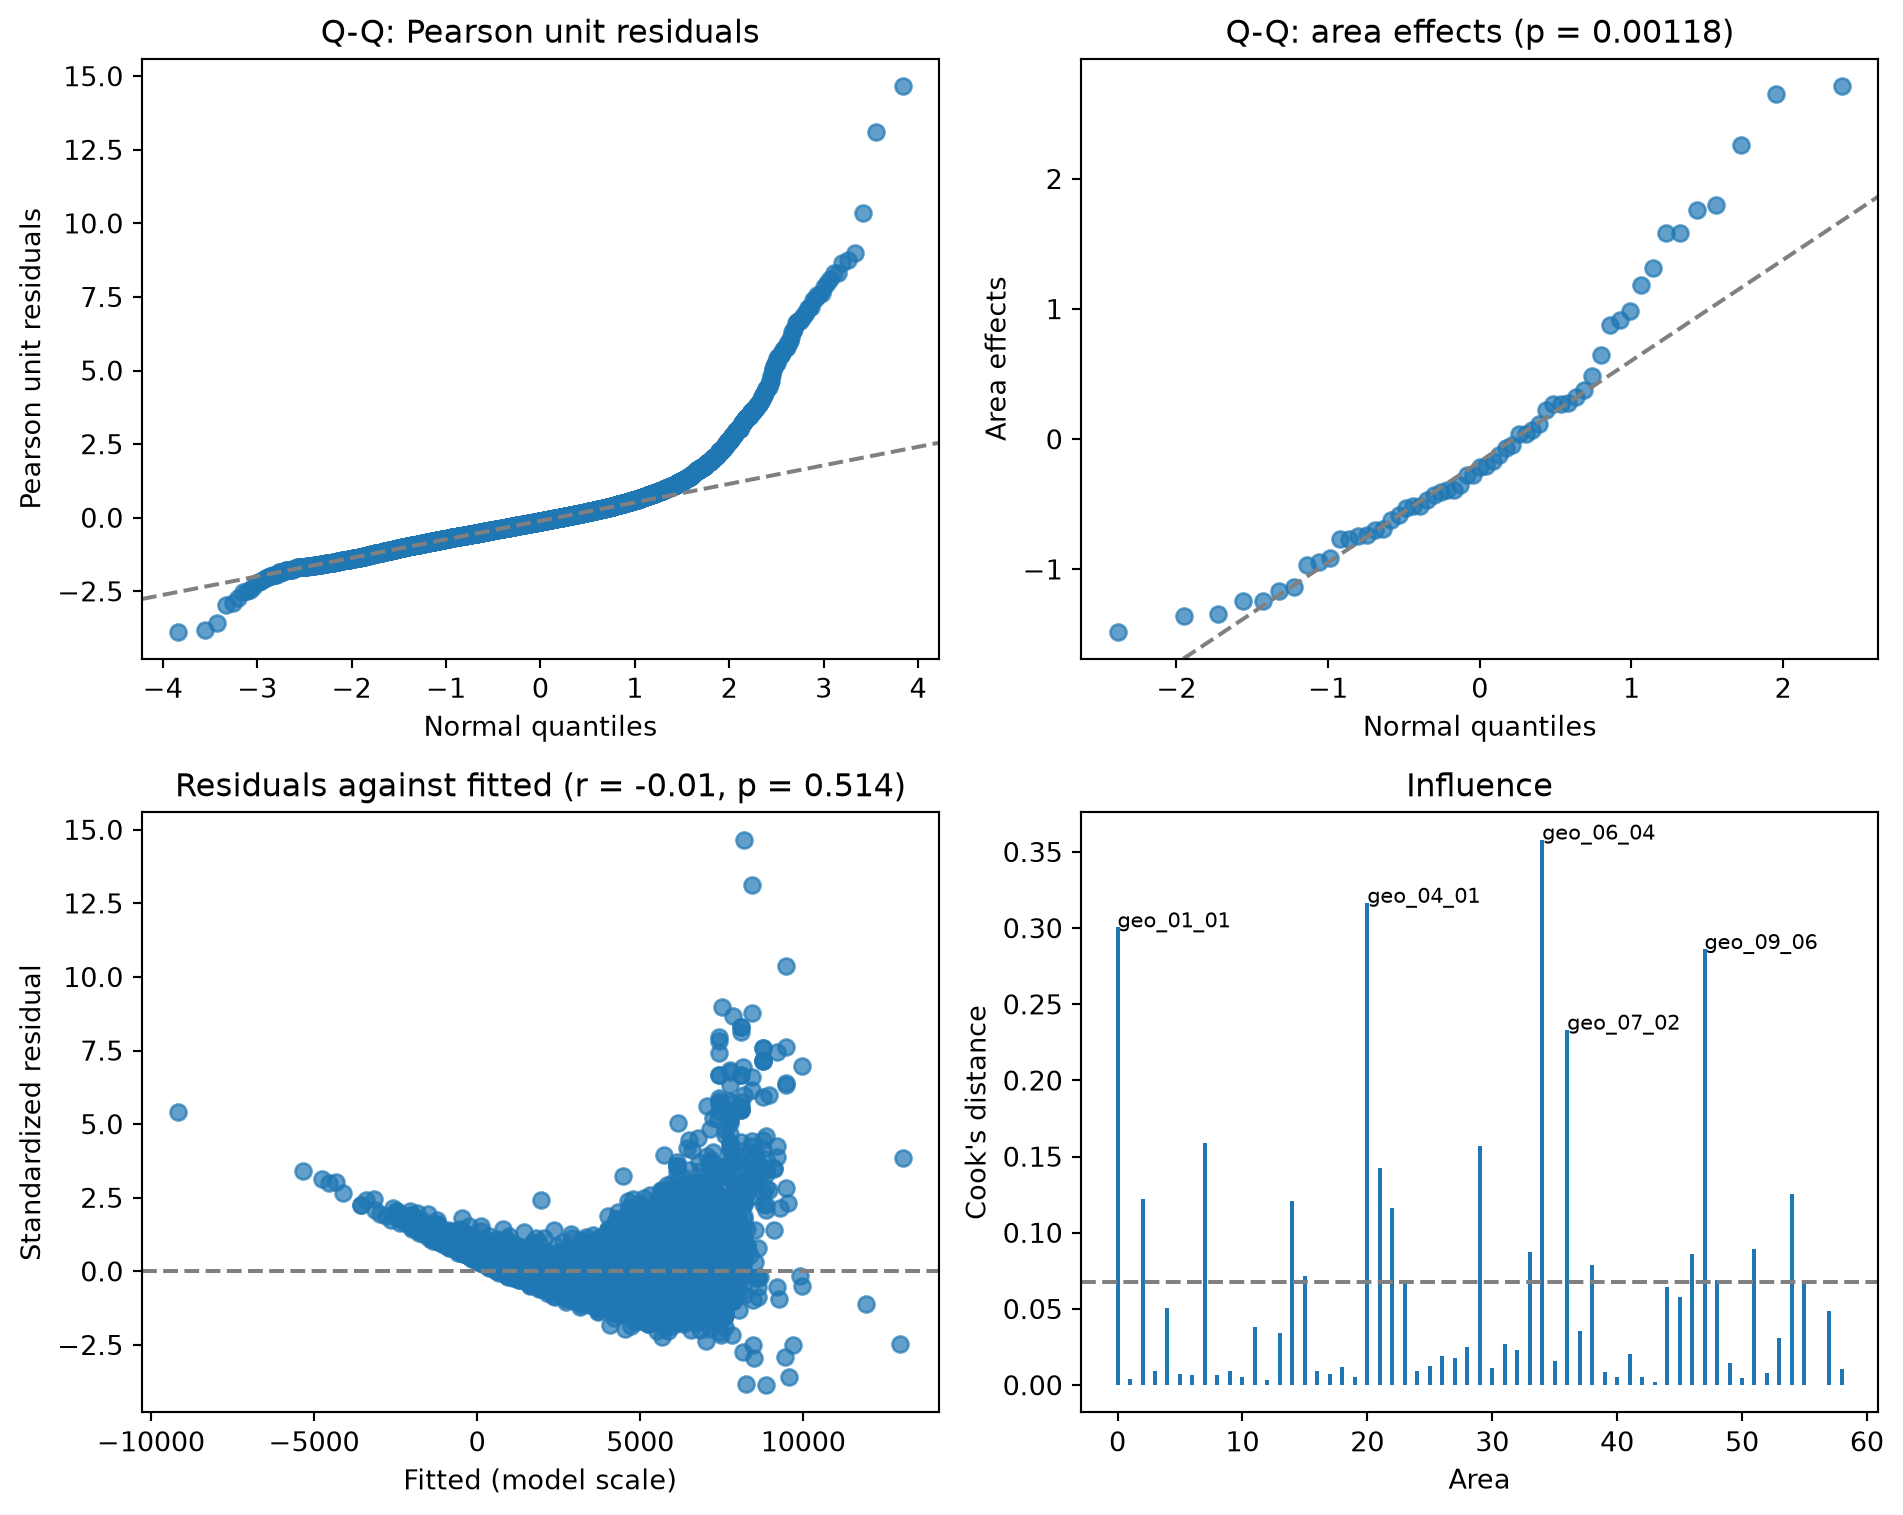
The area effects are not normal, and many districts are influential by the default rule. There is no finding on the unit residuals, but not because they are normal.
Correlation of the residuals with the fitted values and each covariate
vif_*
Variance inflation factor of each covariate
boxcox_lambda, boxcox_shift
For Box–Cox EBP fits, the transformation used
The unit residuals have a skewness of 3.3 and a kurtosis of 26, against 0 and 3 for a normal distribution: expenditure has a long right tail that the model does not capture.
WarningNo normality test past 5,000 units
Shapiro–Wilk is computed for 3 to 5,000 values, as in R’s shapiro.test. With more sampled units, as here, there is no shapiro_residuals test and no SAE_NONNORMAL_RESIDUALS finding: read the skewness and kurtosis, and the Q-Q plot below.
The covariates explain most of the variation (r2_marginal), and the area effects add little to it: the ICC says that 4% of the remaining variance lies between districts.
One of them has a negative fitted expenditure. row finds the households with one in the data:
negative = units.filter(pl.col("fitted_conditional") <0)["row"].to_list()flagged = hld_data.with_row_index("row").filter(pl.col("row").is_in(negative))print(f"Households with a negative fitted value: {flagged.height}")print(f"Their median size: {flagged['hhsize'].median():.0f}, against {hld_data['hhsize'].median():.0f} overall")
Households with a negative fitted value: 314
Their median size: 8, against 4 overall
They are large households. Each member lowers the fitted value by the hhsize coefficient, about 600, and a straight line in household size runs below zero, which a log or Box–Cox scale would prevent.
Area diagnostics
One row per district, with its number of sampled units, predicted area effect, and Cook’s distance for deleting all its units:
The Q-Q plot of the residuals bends away from the line in the upper tail, and the residuals fan out as the fitted values grow. The plots that compare with direct estimates (shrinkage(), model_vs_direct(), cv()) are for area-level fits only.
What a transformation changes
eblup() fits the outcome as it is. ebp() fits the same model on a log or Box–Cox scale and estimates indicators on the original scale, including the mean. n_reps=0 skips the bootstrap MSE, which is enough to compare the diagnostics:
def ebp_fit(transformation):return model.ebp( y="exp_pp", x=covariates, area="geo2", pop_data=census_units, transformation=transformation, indicators=["mean"], threshold=1800.0, n_mc=50, n_reps=0, rstate=12345, )fits = {"none (BHF)": fit, "log": ebp_fit("log"), "boxcox": ebp_fit("boxcox")}def stat(fit, name): test = fit.diagnostics.test(name)returnNoneif test isNoneelse test.p_value if name.startswith("shapiro") else test.statisticpl.DataFrame( {"transformation": label,"skewness of residuals": stat(f, "skewness_residuals"),"kurtosis of residuals": stat(f, "kurtosis_residuals"),"area effects, Shapiro–Wilk p": stat(f, "shapiro_area_effects"),"r2_marginal": stat(f, "r2_marginal"), }for label, f in fits.items())
shape: (3, 5)
transformation
skewness of residuals
kurtosis of residuals
area effects, Shapiro–Wilk p
r2_marginal
str
f64
f64
f64
f64
"none (BHF)"
3.292844
26.214082
0.00118
0.580099
"log"
0.340007
3.847117
0.051418
0.799767
"boxcox"
0.035626
3.701615
0.157813
0.813692
On the log scale the residuals are close to symmetric and the area effects pass the normality test; Box–Cox, which estimates its parameter from the data, does slightly better: